Lee Mager, PhD / AUTOMATION & AI

I make work easier.

I am an unrepentant faff annihilator and love building all manner of knowledge work automations.

Power Platform development · Desktop & cloud automation · AI engineering · Data analysis

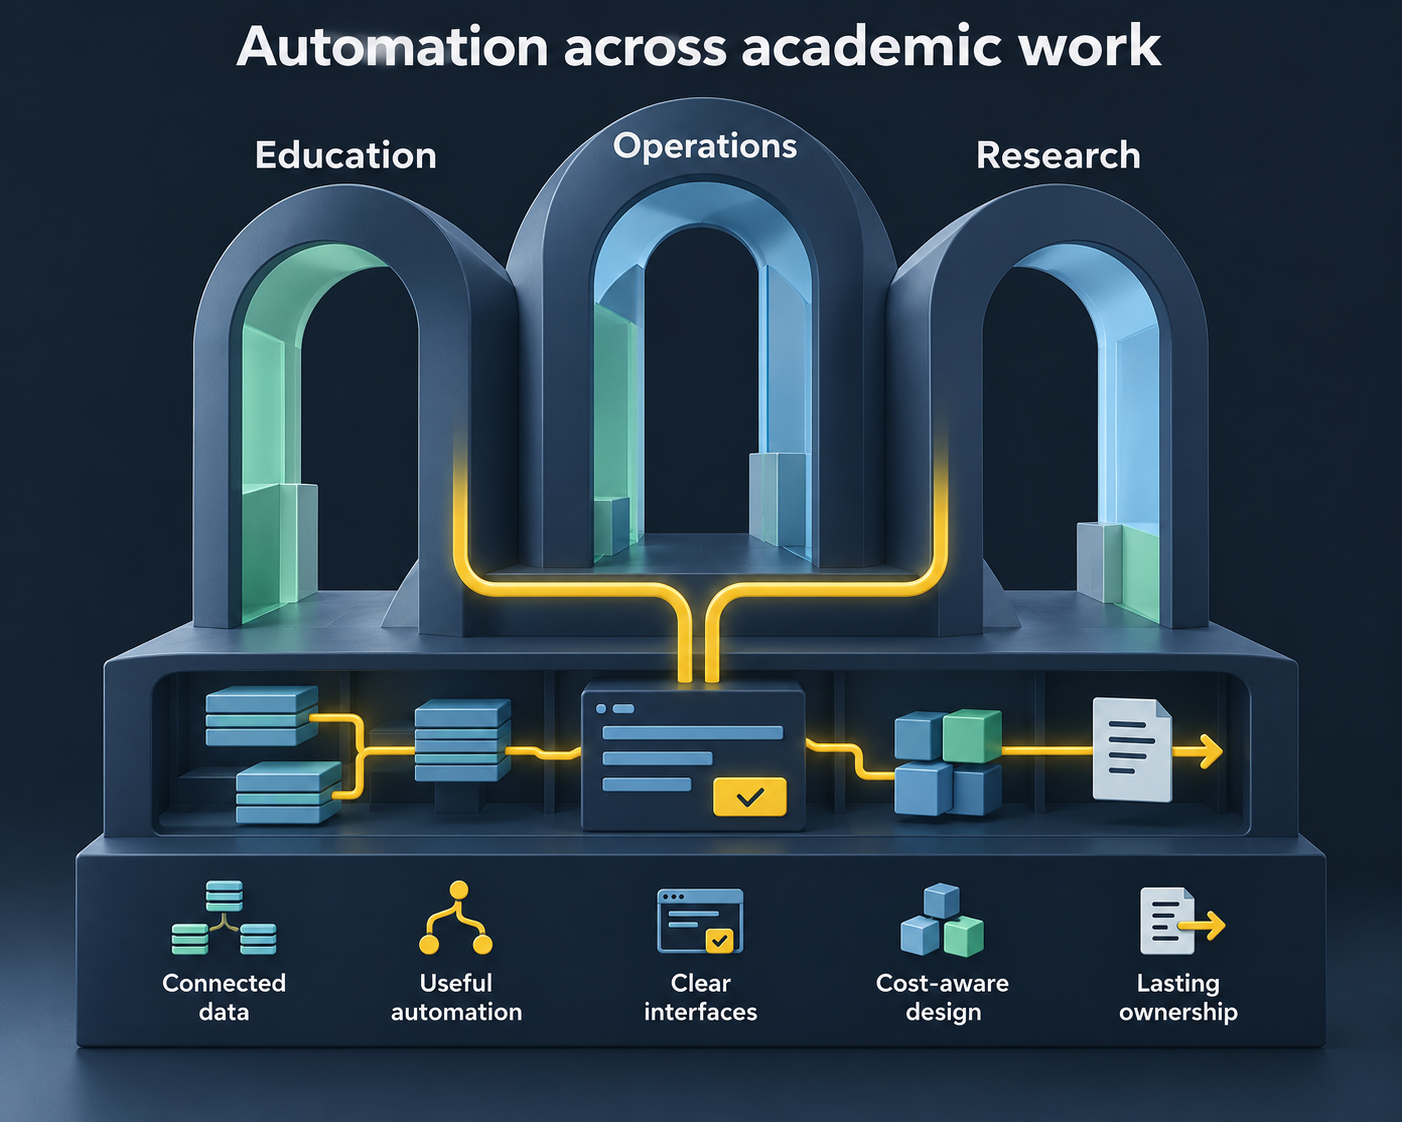
Education, Operations and Research share one foundation of connected data, useful automation, clear interfaces, cost-aware design and lasting ownership.

Made for the real world

University operationsTeaching & assessmentResearch workflows

1 / SELECTED WORK

The below are all real past automation projects I've built since 2020; no real data is shown, it's either dummy/outdated examples and/or redacted sections.

2 / DATA ARCHITECTURE

Make the data you already have
work for your team.

A well-designed data foundation is the underlying power behind useful unattended automations, with a known and maintained single source of truth place for each dataset and a refresh process the team can understand.

Custom M365 solutions with no additional Power Platform licence spend.

I specialise in building within the standard, free Microsoft 365 tools universities already have: SharePoint, OneDrive, Excel, Microsoft Forms, Approvals and Outlook, connected through Power Apps and Power Automate.

Dataverse is the gold standard for a richer relational data model and granular security when premium licensing is available. Where that budget is out of reach, standard free connectors can still deliver a substantial, sustainable working system.

Designed around the organisation’s existing Microsoft 365 entitlements, users and standard connectors. Microsoft licensing guidance ↗

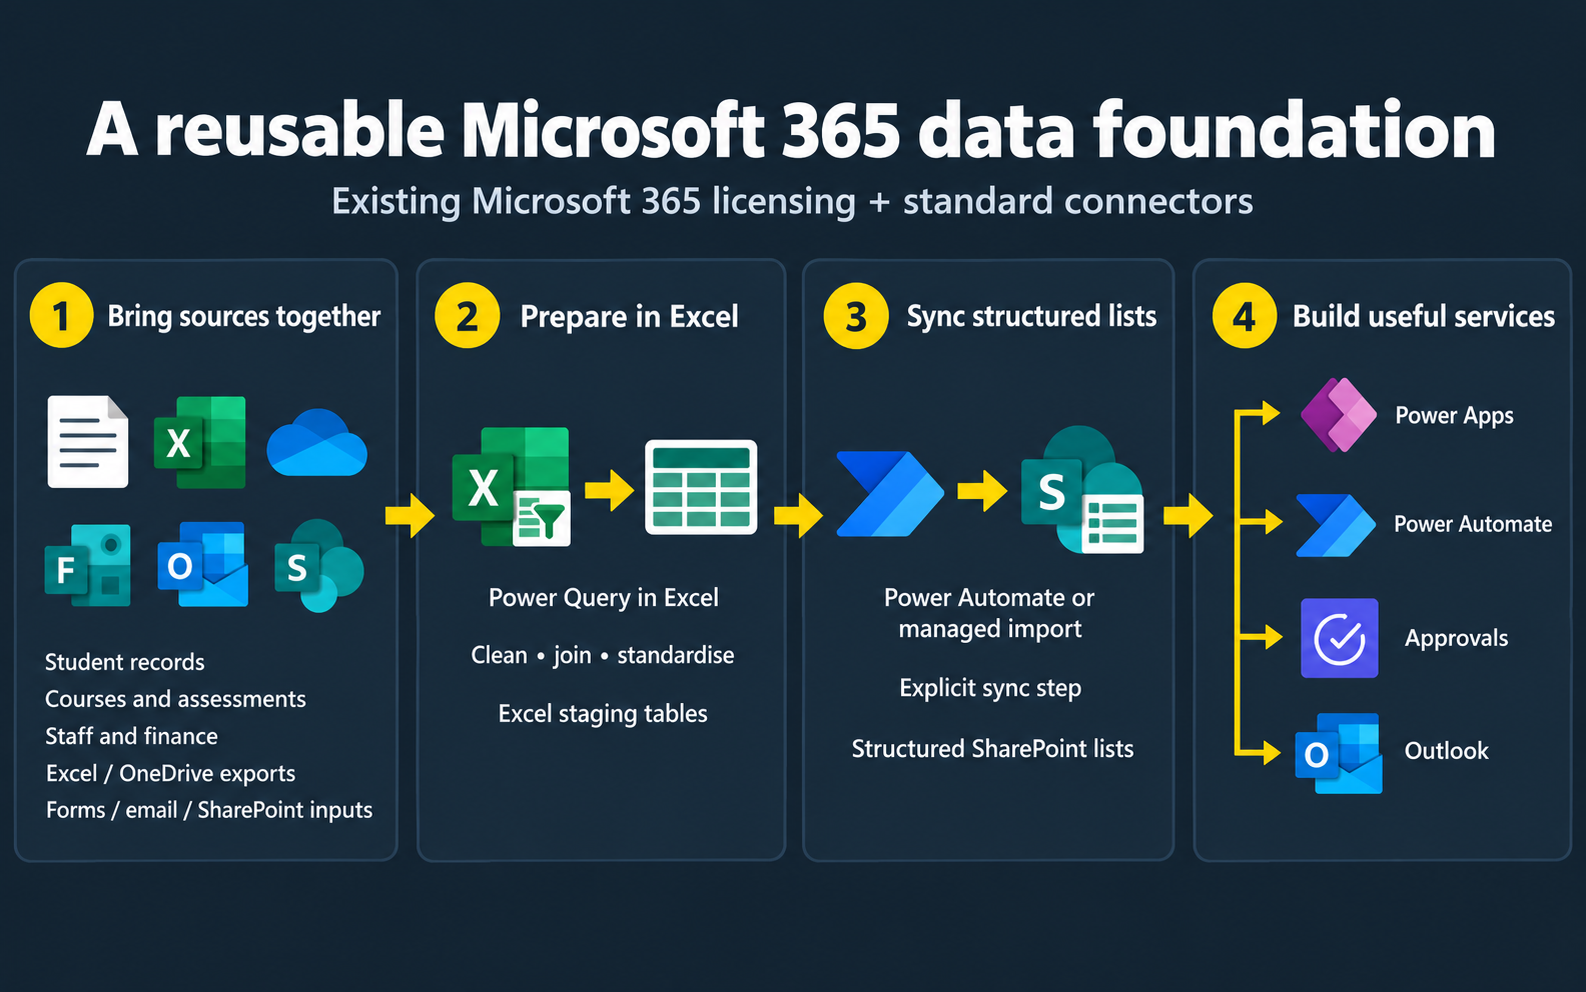
University exports, files and submissions are combined with Power Query in Excel, then imported or synchronised to structured SharePoint lists for apps, workflows, approvals and email.
FROM SCATTERED SOURCES TO REUSABLE DATAView full diagram ↗

POWER QUERY IN EXCEL

Designing the continual data architecture behind the automation

Registration exports, assessment calendars, staffing records and local spreadsheets often describe overlapping parts of the same work. Power Query is an extremely powerful tool packaged within Excel which enables a team to clean and merge datasets into a consistent dataset, with repeatable steps instead of rebuilding the same lookups by hand.

That prepared data can be loaded into Excel tables, then brought into SharePoint through an explicit import or Power Automate sync. Once the lists have reliable keys and useful structure, the same foundation can serve many unattended apps and flows.

1 Prepare once, reuse widely
Standardise column names, data types and identifiers; merge related records and flag missing matches before they enter the workflow.
2 Give the data a clear home
Use structured SharePoint lists for shared operational records, with deliberate access rules and a defined route from source to destination.
3 Make upkeep part of the design
Agree who refreshes each source, how updates are reconciled, and what happens when a file or schema changes. Document the steps for the next owner.

AN EXAMPLE FROM ASSESSMENT ADMINISTRATION

Several tools, one connected data model

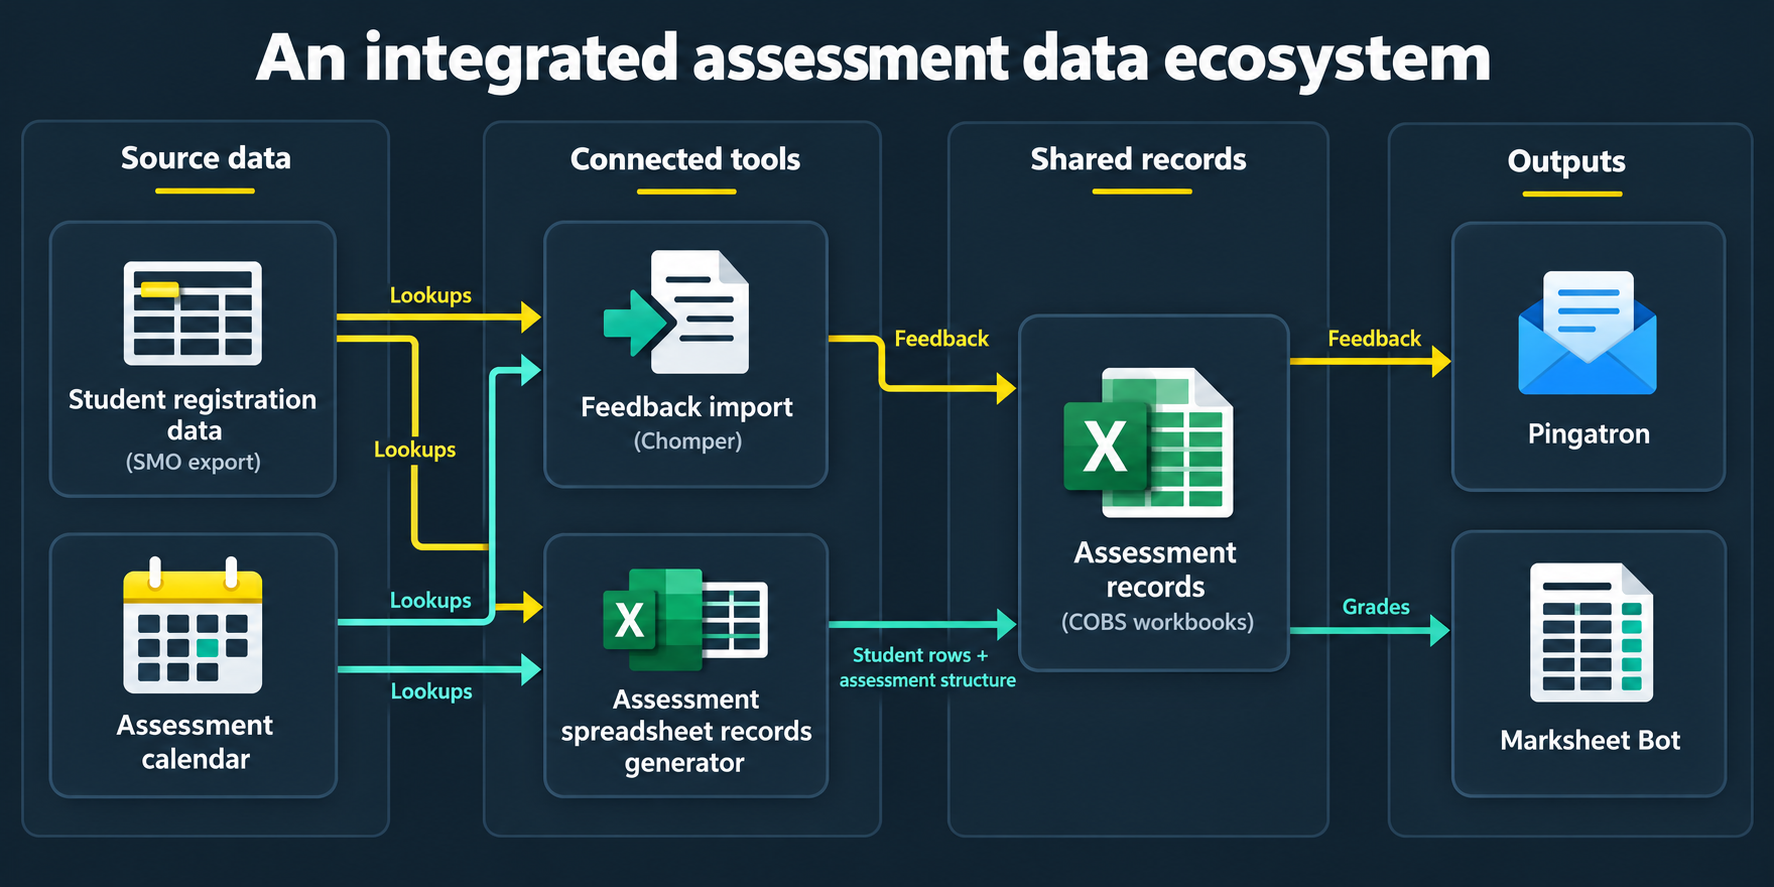
Student registrations and the assessment calendar feed shared assessment records. Feedback delivery and marksheet production then reuse those records, so each tool has a clear role in the wider process.

Student registration data and the assessment calendar supply lookups to Chomper feedback import and the assessment spreadsheet records generator. Both populate shared COBS assessment workbooks, which supply feedback to Pingatron and grades to Marksheet Bot.
SHARED LOOKUPS / CONNECTED PROCESSES / REUSABLE RECORDSView full diagram ↗

3 / DATA ANALYSES

Find the patterns
that inform better decisions.

From the shape of a curriculum to the language of marking, analysis helps people explore what their data can tell them.

Dashboards and analysis for university planning

Power Query is also the core data preparation and transformation engine behind Power BI. The same skills used to combine datasets in Excel carry through to reporting: prepare the data, define the relationships, then build views people can explore. About Power Query ↗

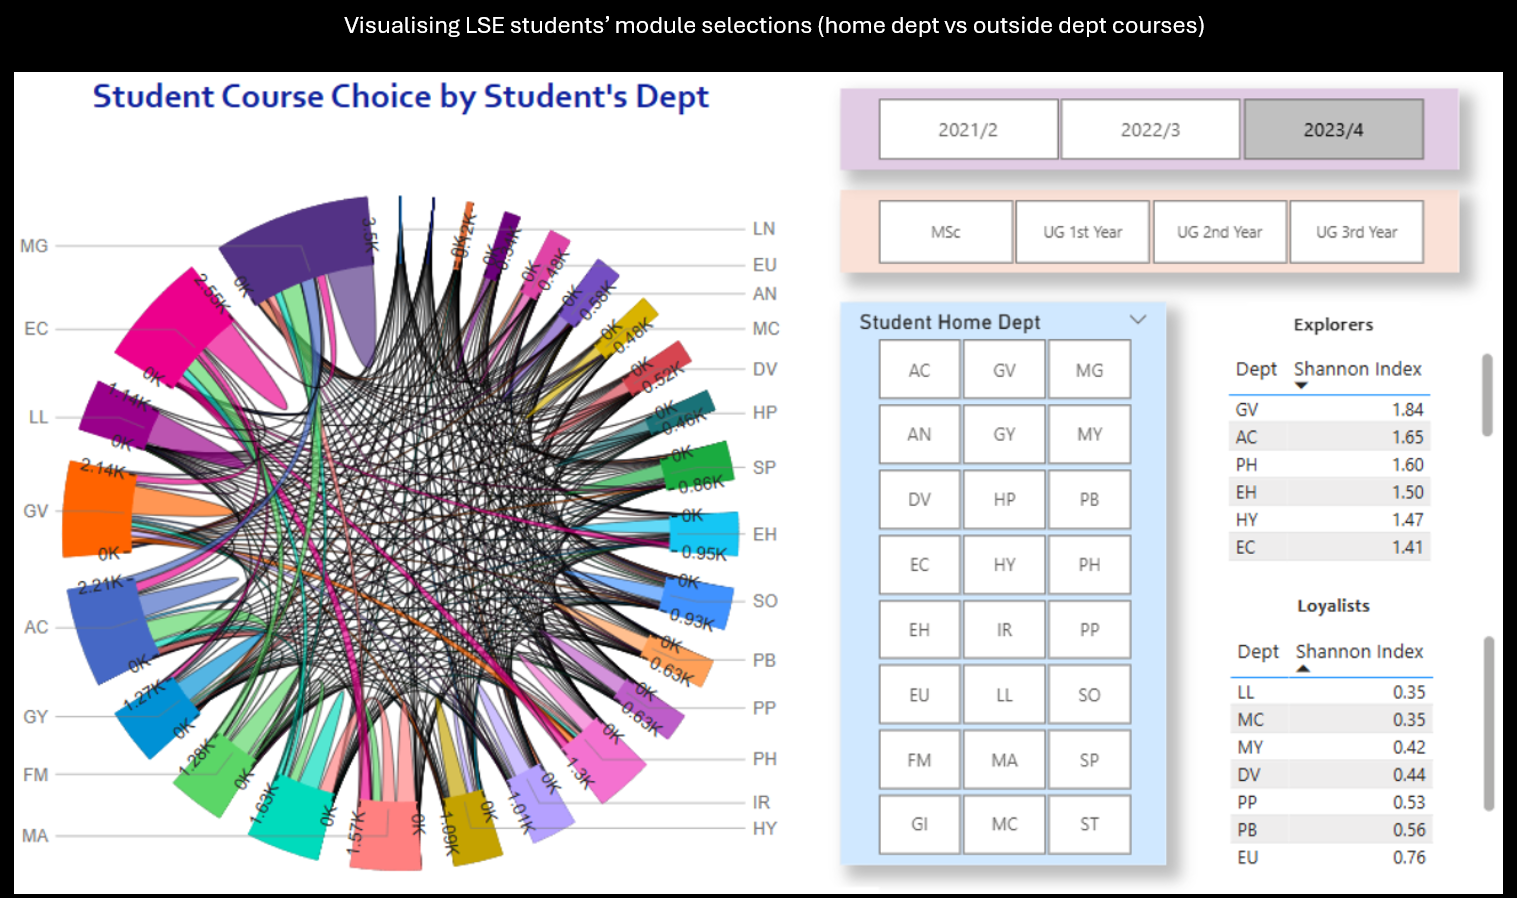
Power BI chord diagram showing course choices between students’ home departments and teaching departments, with year and degree-level filters and Shannon diversity indices.

Cross-department course choices

A view of how students explore courses across departments, with filters for cohort and degree level. Diversity measures help reveal patterns in the breadth of their choices.

Power BI · Chord diagram · Curriculum analysisView full screenshot ↗
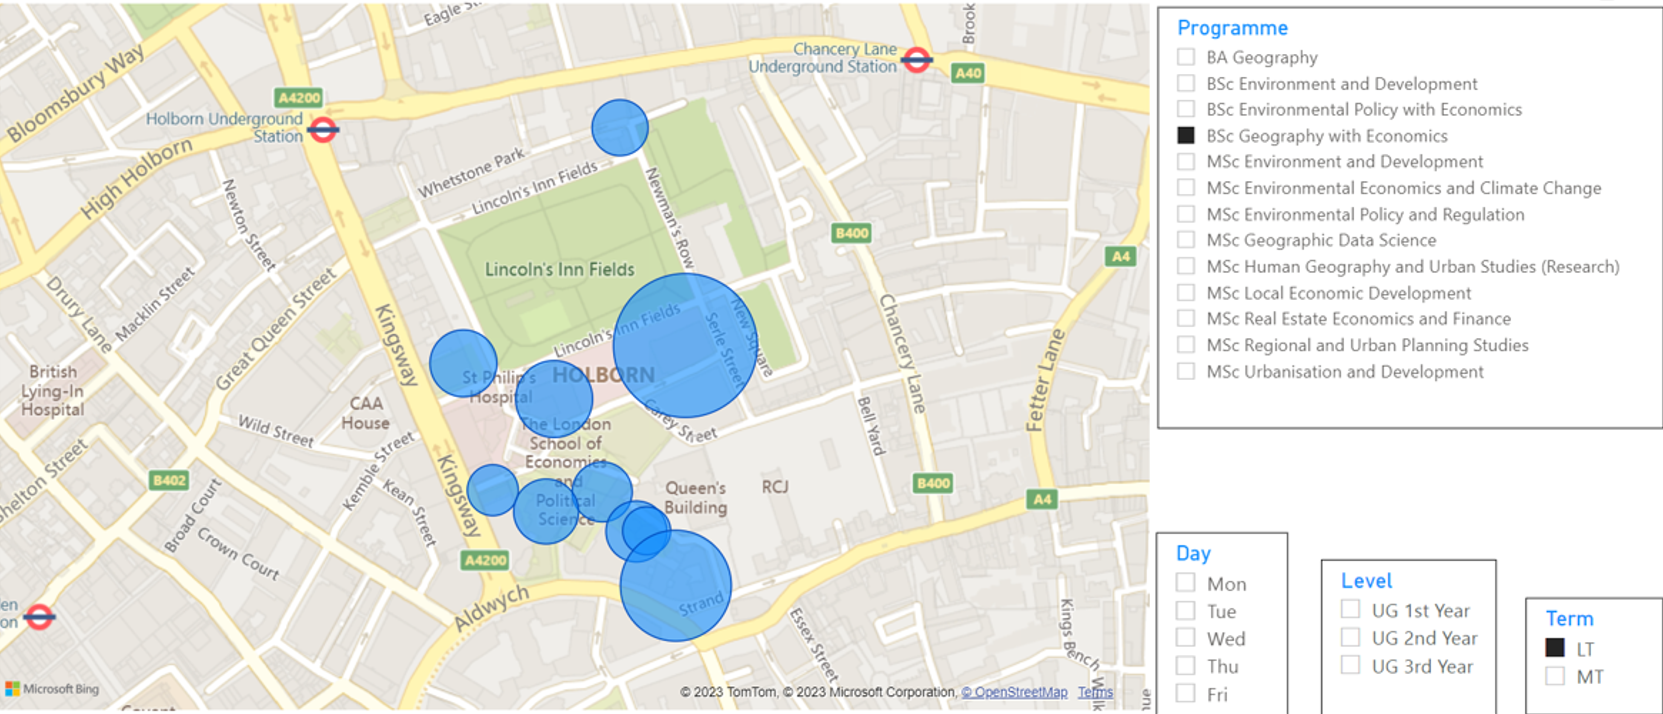
Power BI campus map with teaching-location bubbles and filters for programme, day, degree level and term with bubbles indicating student numbers. Designed to support scheduling events to be easy for students to get to.

Teaching locations across campus

Teaching-location data made spatial: ower BI campus map with teaching-location bubbles and filters for programme, day, degree level and term with bubbles indicating student numbers. Designed to support scheduling events to be easy for students to get to.

Power BI · Mapping · Teaching operationsView full screenshot ↗
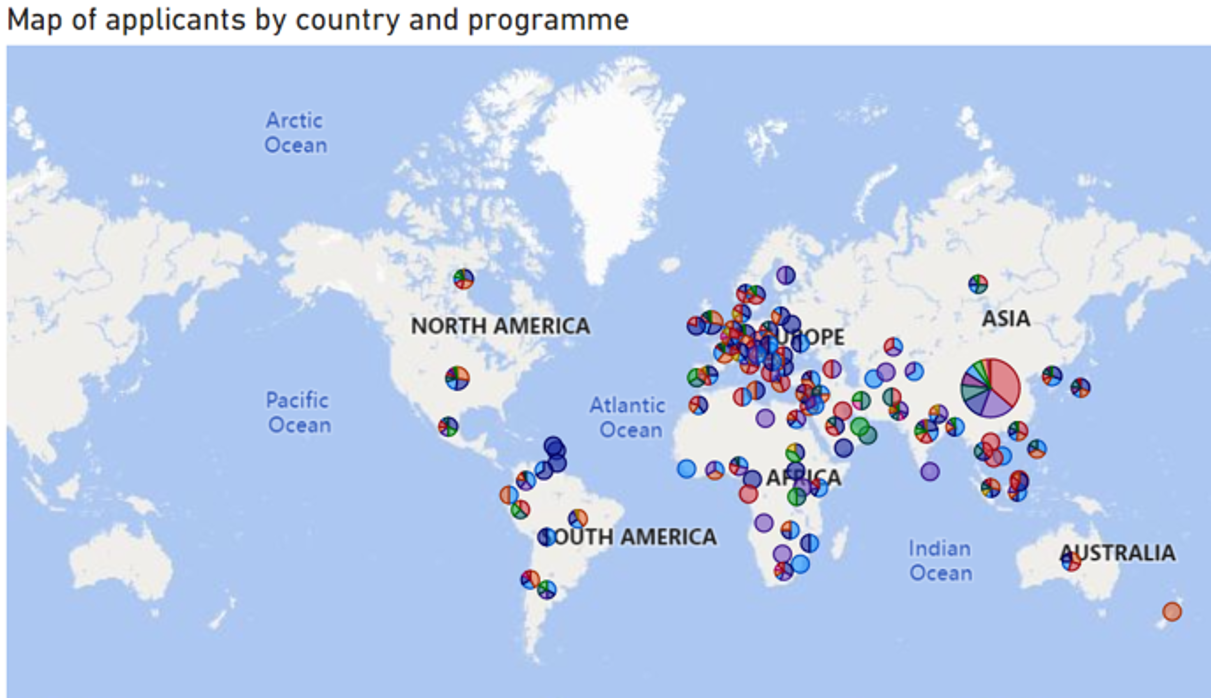
World map of applicants by country, with coloured pie markers showing the programme mix at each location.

Applicant geography by programme

A geographical view of the applicant pool, showing programme mix across countries. A useful starting point for exploring international reach and recruitment patterns.

Power BI · Geographical analysis · RecruitmentView full screenshot ↗
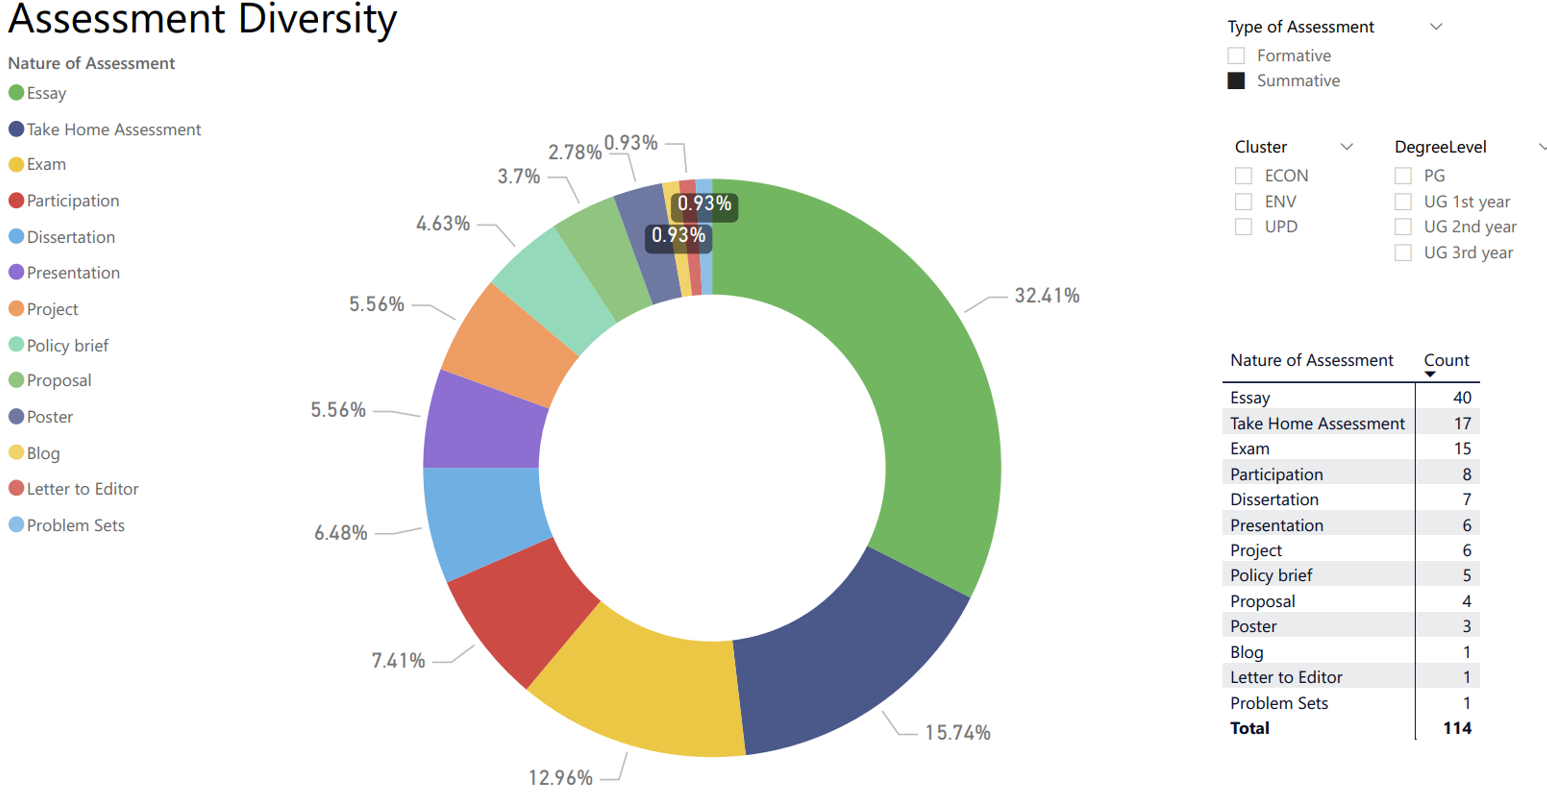
Assessment diversity dashboard with a doughnut chart, assessment counts and filters for formative or summative assessment, subject cluster and degree level.

Assessment mix across the curriculum

Compare essays, exams, presentations and other assessment formats, with filters for level, subject cluster and assessment type. Make the overall assessment mix visible for curriculum review.

Power BI · Assessment design · Curriculum reviewView full screenshot ↗
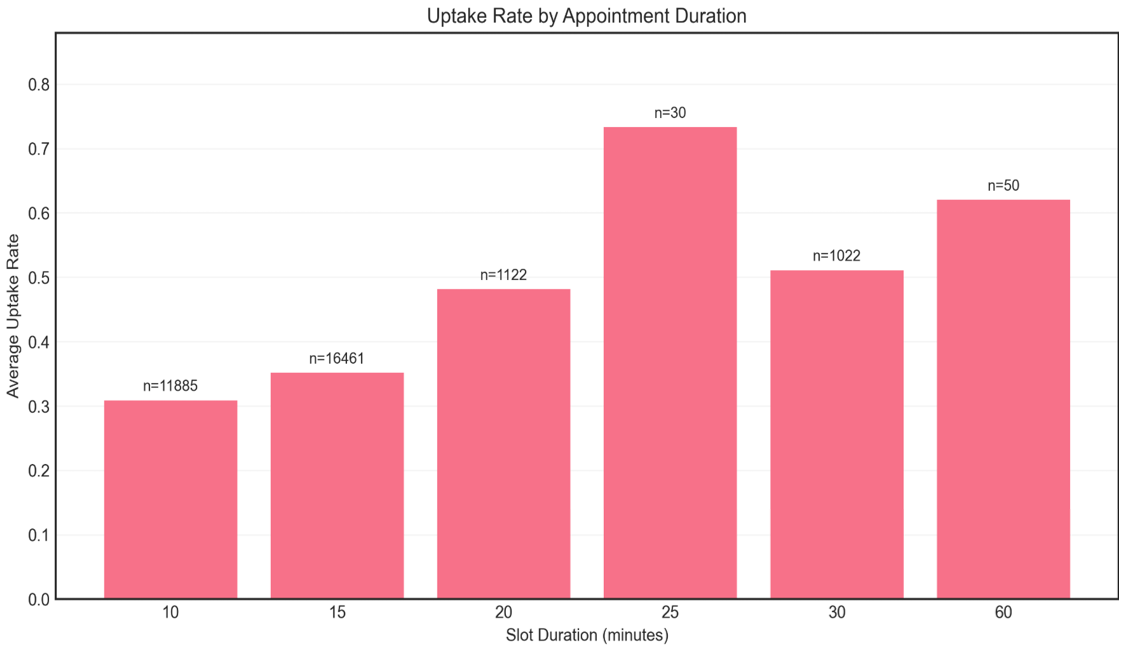
Bar chart comparing average office-hour uptake for appointment lengths of 10, 15, 20, 25, 30 and 60 minutes, with observation counts shown above each bar.

Office-hour uptake and appointment design

A multi-year analysis of student office-hour usage informed a move to a minimum appointment length of 20 minutes, helping the team plan time slots around student uptake.

Operational analysis · Student support · Appointment planningView full chart ↗
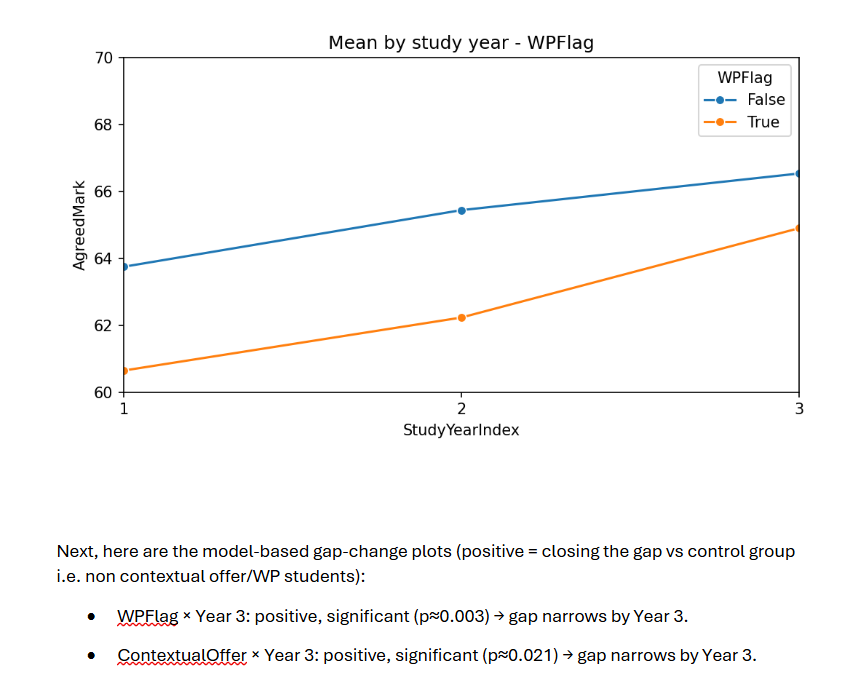
Mean undergraduate marks rise across three study years for both groups, with students admitted through Widening Participation making greater gains and narrowing the gap. Notes beneath the chart report adjusted gap changes from the wider study.

Widening Participation and student progress

A four-year EDI and attainment study found that students admitted through Widening Participation made greater gains across their degree, narrowing the attainment gap by the third year. A fixed-effects model adjusting for prior attainment and student background supported this pattern, giving university leaders evidence to inform student support and inclusion.

The chart shows cohort averages; the adjusted finding comes from the wider study.

Statistical analysis · Fixed effects · EDI and attainmentView full chart ↗

Illustrative screenshots of past dashboards and analyses I built.

LLM FINE-TUNING / MARKER CALIBRATION

What does feedback language suggest about the grade?

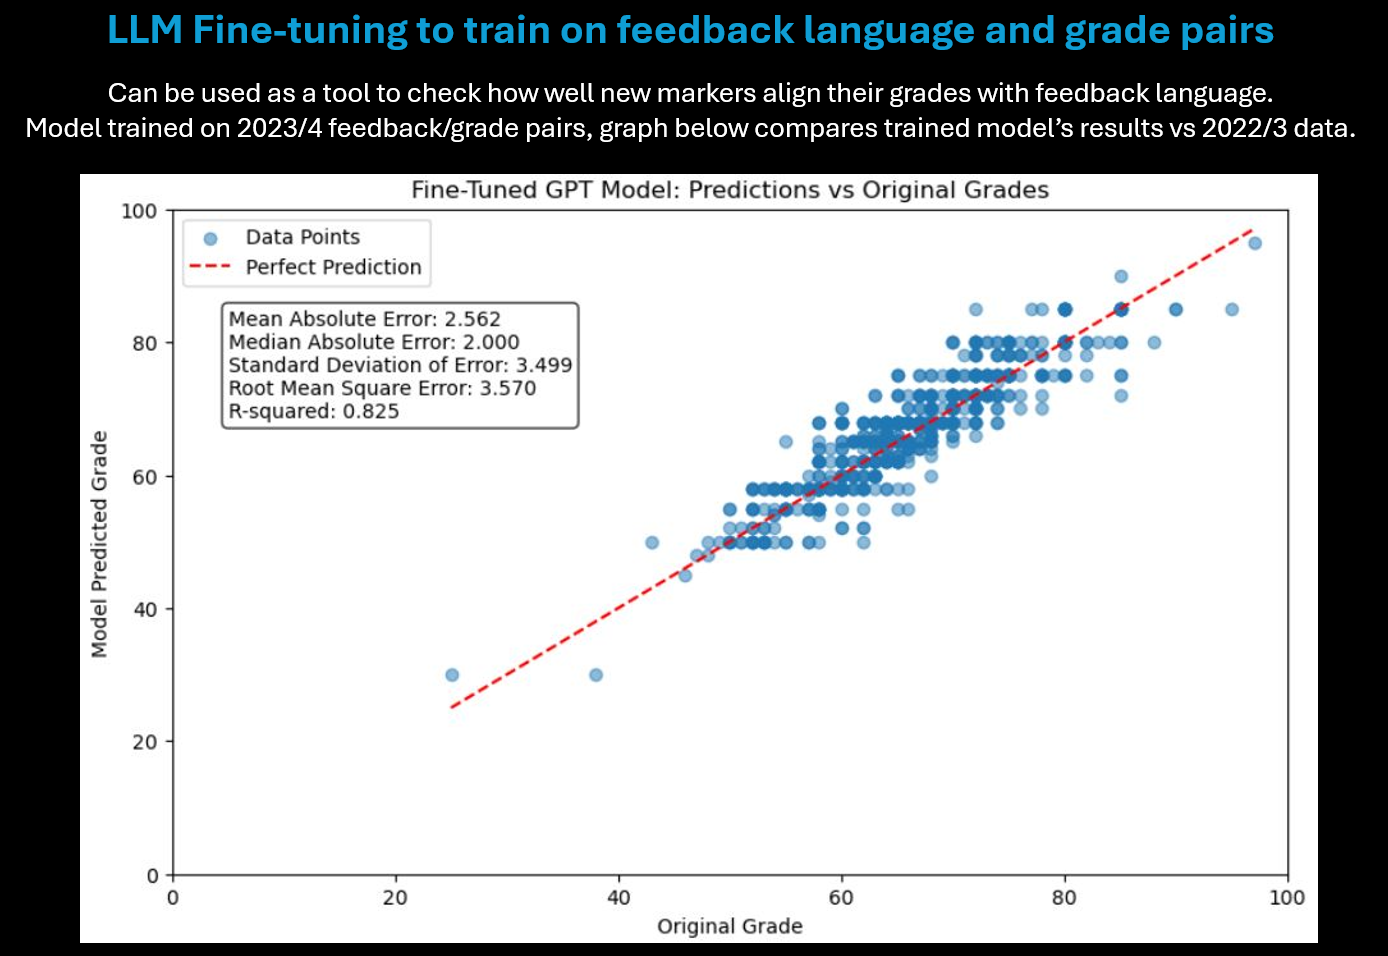
I fine-tuned a model on historical feedback comments paired with grades, then compared its predictions with a separate academic year. The close correspondence in this chart is an encouraging example of generalisation across cohorts.

The potential use is a calibration aid: a new marker can enter their feedback and compare the model’s suggested grade with historical departmental standards. The marker makes the academic judgement; the prediction encourages reflection on grade/comment alignment.

Mean absolute error
2.562 grade points
R²
0.825

Results shown: trained on 2023/24 feedback–grade pairs; evaluated against 2022/23 data.

Fine-tuned model predictions plotted against original grades for a separate cohort. The supplied chart reports mean absolute error 2.562, median absolute error 2.000, error standard deviation 3.499, RMSE 3.570 and R-squared 0.825.
Original experiment chart · View full size ↗

4 / HOW I THINK

Custom, working solutions.

The audience / end users are everything. Understanding the work, the risk/value balance and planning ahead for who will look after a solution long-term are fundamental to all my projects.

1

Start with the work

Start with identifying the pain points. Make the business problem clear before choosing the technology.

2

Design for the actual audience

Academics and administrators have enough to think about. Clear language, well-timed cues and fewer decisions can make a tool feel effortless.

3

Design the data architecture

Understand where the data comes from, how it connects and who owns it. Reliable structure, access rules and refresh processes give every app and automation a foundation the team can maintain.

4

Build for the next person

Handover is part of delivery. My approach is to make the logic understandable, document the decisions, and agree how a working solution will be owned and developed long-term.

5 / WHAT’S NEXT?

What faff would you like to annihilate?

lee@automager.co.uk

AutomagerPROJECT NOTES